Safe At Any Speed?
Is Bristol any safer than anywhere else for cycling? How could it be made safer? These are questions that provoke interesting discussions, but they are also of that irritating kind that can't be answered before you know who is asking, what they really want to know, and what use they intend to make of the answers once you've worked them out. It is also worth saying that the more certain we are of the correct answer, the more likely we are to be wrong.
Understandably, cycling casualties have been in the news. London has suffered a series of fatalities that had been predicted and that could have been avoided. Not many weeks ago the Department for Transport issued data for 2010 that showed UK cycling casualties overall had risen, despite other categories showing improved figures. That was disappointing after we had got used to numbers edging downwards every year.
Change in casualty rates for cyclists in the UK 1994-2010
|
Pedal cyclists
|
1994 – 1998
average
|
2009
|
2010
|
Percentage
change over
1994 – 1998
average
|
Percentage
change from last
year
|
Killed
|
186
|
104
|
111
|
-40
|
+7
|
Seriously injured
|
3,546
|
2,606
|
2,660
|
-25
|
+2
|
Slightly injured
|
20,653
|
14,354
|
14,414
|
-30
|
0
|
All casualties
|
24,385
|
17,064
|
17,185
|
-30
|
+1
|
Department for Transport (2011)
In a country of 62,300,000 (mid-2010) the increase in cycle casualties is a tiny fraction. But each single digit is one whole person. And just when we thought things were getting better for cycling, doubts have been raised about the trend. The data show other road-users on a continuing downward pattern of casualties. It's very disappointing that while more cycling overall has done wonders for the well-being of cyclists, the genreal health improvements have not gone alongside continuing reductions in casualty reports.
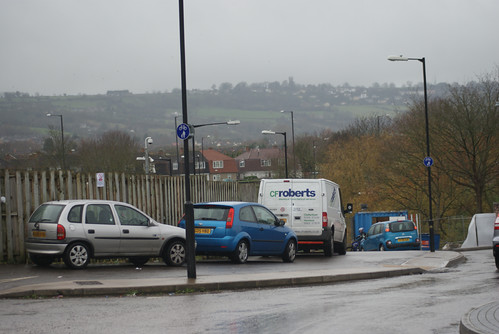
I was interested to see how we were doing in Bristol. I approached Bristol City Council's Strategy and Programmes Team from Transport Service and they very kindly sent me several sets of printouts from their road traffic incident data for the three years up to the end of August this year. In conjunction with the finely-detailed maps at
Explore Bristol I was able to get a good feel for the scale and nature of our problems. All that follows is inevitably my own interpretation.
Whatever ever else I might claim, I know enough about collecting, analysing and interpreting data to know that "evidence" never confirms our simple assumptions and "the facts" have a tendency to lose their clarity when we look more closely at them and consider things like how the data were collected in the first place and how words like "slight" or "serious" are defined in principle and used in practice. So don't spend too much time unpicking details – the patterns and the big picture are what I was interested in. These are the things that you can't see at all from your own bike or footpath, things that you can't know through anecdotes.
Between September 1st 2008 and August 30th 2011 there were 805 Police reports of bicycle-related accidents in Bristol. There would have been another set of casualties or bumps that weren't recorded but what we do know is that police reports show the following:
- 3 cyclists (all adults of 16 or over) were reported to have died;
- 102 (of whom 10 were children) were listed as injured seriously enough to need in-patient treatment and;
- 686 (47 children) were recorded with injuries that were classified as "slight".
The cyclist figures compare with pedestrian figures of:
- 13 fatalities (2 of whom were children);
- 103 seriously injured (22 children) and;
- 580 slightly injured (137 children) in the same period.
A crude average gives 1 cyclist death and 4 pedestrian deaths per year in Bristol over the three years in question. For serious injuries the figures are 34 per year for cyclists and the same for pedestrians. Slight injuries average out at 228 for cyclists and 193 per year for pedestrians.
The tables and graphs that follow show us that pedestrians suffer more fatalities than cyclists, but have comparable numbers being injured. In relation to age it shows that people of 16 or above are much more involved than children in cycling causalities whereas among pedestrians the injuries among the under 16 are relatively more common. We also see that males are much more numerous among the casualties. They might be more likely than women to cycle, but their record as pedestrians is almost as bad. The figures in these tables are derived from data provided by Bristol City Council and have not been independently checked, so they might be subject to my own errors.
Cyclist and pedestrian casualties by age in Bristol September 2008-August 2011
|
|
Pedal cyclists
|
Pedestrians
|
Totals
|
Under 16
|
16 and over
|
All Cyclists
|
Under 16
|
16 and over
|
All Pedestrians
|
Fatal
|
0
|
3
|
3
|
2
|
11
|
13
|
16
|
Seriously injured
|
10
|
92
|
102
|
22
|
81
|
103
|
205
|
Slightly injured
|
48
|
638
|
686
|
137
|
443
|
580
|
1266
|
All casualties
|
58
|
733
|
791
|
161
|
535
|
696
|
1487
|
(based on data provided by Bristol City Council 2011)
Cyclist and pedestrian casualties by sex in Bristol September 2008-August 2011
|
|
Pedal cyclists
|
Pedestrians
|
Totals
|
Female
|
Male
|
All Cyclists
|
Female
|
Male
|
All Pedestrians
|
Fatal
|
0
|
3
|
3
|
2
|
11
|
13
|
16
|
Seriously injured
|
20
|
82
|
102
|
39
|
64
|
103
|
205
|
Slightly injured
|
142
|
544
|
686
|
222
|
358
|
580
|
1266
|
All casualties
|
162
|
629
|
791
|
263
|
433
|
696
|
1487
|
(based on data provided by Bristol City Council 2011)
When Police record accidents their standard form has a long section on "contributory factors" with 76 factors organised in 9 categories (with "other please specify" as the 77th option). Each factor is attributed to one or more of the vehicles involved, so guesses can be made about whose "fault" the accident might be. But they would be guesses, and I would advise against trusting them. Looking at Bristol's analysis of which contributory factors are reported most frequently, the pattern jumps out very quickly. It's so marked that I suspect the process of filling in the form might contribute, a possibility given weight by the fact that slightly more than half of all the accident reports had no contributory factors listed at all. Nevertheless, the data that we have include two factors which, alone, account for a third of all the attributions: "Failed to look properly" and "Poor turn or manoeuvre" are mentioned 230 and 58 times respectively. Everything else shades off into insignificance, with "Cyclist entering road from pavement" making an appearance at the next level with nearly ten per cent of all identified factors and 18 citations as the first-mentioned factor. The table of factors that follows is listed in order of the number of times each was cited, regardless of its primacy in each report. Close examination will reveal those factors most often mentioned first. I feel the need to repeat an earlier warning - "blame" cannot be assigned on the basis of such a table. What we have here is an attempt to present an accurate record of the factors reported by police officers in one part of a standard proforma. Weather, visibility and road condition are reported under another heading.
Contributory factors listed in 353 accident report forms September 2008 - August 2011
|
Description
|
CF1
|
CF2
|
CF3
|
CF4
|
CF5
|
CF6
|
Count
|
%
|
Failed to look properly
|
122
|
72
|
28
|
6
|
2
|
0
|
230
|
28.4
|
Failed to judge other persons path or speed
|
15
|
35
|
13
|
8
|
3
|
2
|
76
|
9.38
|
Careless/Reckless/In a hurry
|
13
|
18
|
15
|
13
|
1
|
3
|
63
|
7.78
|
Poor turn or manoeuvre
|
40
|
11
|
4
|
2
|
1
|
0
|
58
|
7.16
|
Passing too close to cyclist, horse rider or pedestrian
|
9
|
7
|
8
|
5
|
1
|
0
|
30
|
3.7
|
Stationary or parked vehicle
|
5
|
10
|
6
|
6
|
2
|
1
|
30
|
3.7
|
Cyclist entering road from pavement
|
18
|
4
|
2
|
4
|
0
|
1
|
29
|
3.58
|
Travelling too fast for conditions
|
11
|
7
|
3
|
1
|
0
|
1
|
23
|
2.84
|
Disobeyed Give Way or Stop sign or markings
|
11
|
3
|
1
|
0
|
1
|
0
|
16
|
1.98
|
Vehicle door opened or closed negligently
|
9
|
5
|
0
|
1
|
0
|
0
|
15
|
1.85
|
Failed to signal/Misleading signal
|
6
|
5
|
2
|
1
|
0
|
0
|
14
|
1.73
|
Slippery road (due to weather)
|
10
|
1
|
0
|
2
|
0
|
0
|
13
|
1.6
|
Cyclist wearing dark clothing at night
|
2
|
3
|
4
|
4
|
0
|
0
|
13
|
1.6
|
Impaired by alcohol
|
7
|
3
|
2
|
0
|
0
|
0
|
12
|
1.48
|
Disobeyed automatic traffic signal
|
7
|
3
|
1
|
0
|
0
|
0
|
11
|
1.36
|
Loss of control
|
4
|
3
|
2
|
1
|
1
|
0
|
11
|
1.36
|
Illegal turn or direction of travel
|
7
|
2
|
0
|
0
|
1
|
0
|
10
|
1.23
|
Road layout (eg bend, winding road, hill crest)
|
2
|
3
|
3
|
2
|
0
|
0
|
10
|
1.23
|
Junction overshoot
|
5
|
2
|
2
|
0
|
0
|
0
|
9
|
1.11
|
Junction restart
|
4
|
4
|
1
|
0
|
0
|
0
|
9
|
1.11
|
Road layout (eg bend, hill, narrow road)
|
6
|
0
|
0
|
1
|
1
|
0
|
8
|
0.99
|
Following too close
|
3
|
4
|
1
|
0
|
0
|
0
|
8
|
0.99
|
Sudden braking
|
1
|
4
|
2
|
1
|
0
|
0
|
8
|
0.99
|
Inexperienced or learner driver/rider
|
1
|
1
|
4
|
1
|
1
|
0
|
8
|
0.99
|
Vehicle blind spot
|
1
|
4
|
0
|
2
|
1
|
0
|
8
|
0.99
|
Dazzling sun
|
5
|
0
|
1
|
1
|
0
|
0
|
7
|
0.86
|
Not displaying lights at night or in poor visibility
|
3
|
2
|
1
|
0
|
1
|
0
|
7
|
0.86
|
Rain, sleet, snow, or fog
|
1
|
1
|
2
|
3
|
0
|
0
|
7
|
0.86
|
Failed to look properly
|
2
|
1
|
2
|
0
|
1
|
0
|
6
|
0.74
|
Disobeyed pedestrian crossing facility
|
3
|
0
|
2
|
0
|
0
|
0
|
5
|
0.62
|
Distraction outside vehicle
|
2
|
1
|
2
|
0
|
0
|
0
|
5
|
0.62
|
Defective brakes
|
3
|
1
|
0
|
0
|
0
|
0
|
4
|
0.49
|
Illness or disability, mental or physical
|
3
|
0
|
0
|
0
|
1
|
0
|
4
|
0.49
|
Inadequate/Masked signs or road markings
|
3
|
0
|
0
|
0
|
0
|
0
|
3
|
0.37
|
Vehicle travelling along pavement
|
1
|
1
|
1
|
0
|
0
|
0
|
3
|
0.37
|
Distraction in vehicle
|
1
|
2
|
0
|
0
|
0
|
0
|
3
|
0.37
|
Vegetation
|
1
|
1
|
0
|
0
|
0
|
1
|
3
|
0.37
|
Swerved
|
0
|
2
|
0
|
1
|
0
|
0
|
3
|
0.37
|
Fatigue
|
0
|
3
|
0
|
0
|
0
|
0
|
3
|
0.37
|
Aggressive driving
|
0
|
1
|
1
|
0
|
1
|
0
|
3
|
0.37
|
Other
|
0
|
1
|
0
|
0
|
2
|
0
|
3
|
0.37
|
Driver using mobile phone
|
0
|
1
|
1
|
0
|
0
|
0
|
2
|
0.25
|
Buildings, road signs, street furniture
|
0
|
1
|
0
|
0
|
1
|
0
|
2
|
0.25
|
Dazzling headlights
|
0
|
1
|
1
|
0
|
0
|
0
|
2
|
0.25
|
Spray from other vehicles
|
0
|
0
|
1
|
0
|
1
|
0
|
2
|
0.25
|
Careless/Reckless/In a hurry
|
0
|
0
|
0
|
1
|
1
|
0
|
2
|
0.25
|
Poor or defective road surface
|
1
|
0
|
0
|
0
|
0
|
0
|
1
|
0.12
|
Traffic calming (eg speed cushions, humps, chicanes)
|
1
|
0
|
0
|
0
|
0
|
0
|
1
|
0.12
|
Temporary road layout (eg contraflow)
|
1
|
0
|
0
|
0
|
0
|
0
|
1
|
0.12
|
Defective lights or indicators
|
1
|
0
|
0
|
0
|
0
|
0
|
1
|
0.12
|
Wrong use of pedestrian crossing facility
|
1
|
0
|
0
|
0
|
0
|
0
|
1
|
0.12
|
Vehicle in course of crime
|
1
|
0
|
0
|
0
|
0
|
0
|
1
|
0.12
|
Inexperience of driving on the left
|
0
|
0
|
1
|
0
|
0
|
0
|
1
|
0.12
|
Dangerous action in carriageway (eg playing)
|
0
|
0
|
0
|
1
|
0
|
0
|
1
|
0.12
|
Emergency vehicle on call
|
0
|
1
|
0
|
0
|
0
|
0
|
1
|
0.12
|
(based on data provided by Bristol City Council 2011)
It doesn't take a lot of reflection to recognise that most of the people we know never cycle, or cycle only infrequently. People who do cycle or who are considering cycling might wonder what the likelihood is that they might have some kind of bump. The data suggest that compared to other ways of travelling, bumps per mile are on the high side for bikes. In the South West region (see the table below) an odd Department for Transport measure shows over five thousand bumps for every billion miles travelled by cyclists. Only motor bikes have a worse prognosis in the South West, and only cyclists in London and the North West do worse for knocks than the South West.
Reported casualty rate per billion vehicle miles by region and road user type, England, 2010
|
|
|
Rate per billion vehicle miles
|
Region
|
Pedal
cycle
|
Motor
cycle
|
Car
|
Bus
|
Light
goods
|
HGV
|
All
|
North East
|
5,073
|
6,130
|
551
|
2,636
|
143
|
105
|
675
|
North West
|
6,479
|
6,875
|
592
|
2,286
|
104
|
82
|
712
|
Yorkshire and the Humber
|
4,957
|
6,716
|
660
|
2,751
|
115
|
101
|
764
|
East Midlands
|
4,832
|
6,758
|
576
|
1,944
|
125
|
83
|
655
|
West Midlands
|
4,901
|
6,065
|
552
|
1,234
|
118
|
82
|
626
|
East of England
|
3,400
|
5,876
|
500
|
869
|
98
|
95
|
567
|
London
|
10,211
|
9,548
|
839
|
3,654
|
207
|
131
|
1,450
|
South East
|
5,024
|
5,825
|
483
|
1,844
|
95
|
105
|
581
|
South West
|
5,350
|
4,711
|
470
|
1,144
|
82
|
94
|
567
|
England
|
5,638
|
6,610
|
561
|
2,072
|
113
|
94
|
694
|
Data from http://www.dft.gov.uk/statistics/tables/ras30055
The odd measure being used in that table needs a bit of cooling down I think, but the differences are real and it does suggest that London has a much bigger problem than Bristol (or anywhere else). We need to note that a large majority of cycling casualiteies are "slight", and that they don't happen all that often, even to individuals who cycle quite a lot.
On a low-side estimate, I cycled about 50,000 miles on the roads of northern England between 1984 and 2010. In the process I suffered a number of small collisions and upsets. Maybe 4 or 5. One resulted in a very anxious motorist with a badly damaged car buying me a new bike and taking me home, more or less unhurt. A bruised rib, minor cuts and torn clothing resulted from others. One ended with a couple of stitches and a £25 fine for cycling without due care and attention (I had set off in the dark, head down, straight into the back of an unattended parked car). This was the one that would have appeared in national statistics: two stitches in A and E made the difference between it being recorded and not being recorded.
If we count Bristol's population at half a million and put bits of the data together then we can avearge out one recorded cycling casualty for every 634 people and one pedestrian casualty for every 718 people over the last three years. To put that another way, if you know 315 people in Bristol, one of them has had a reportable cycling or pedestrian accident in the last 3 years.
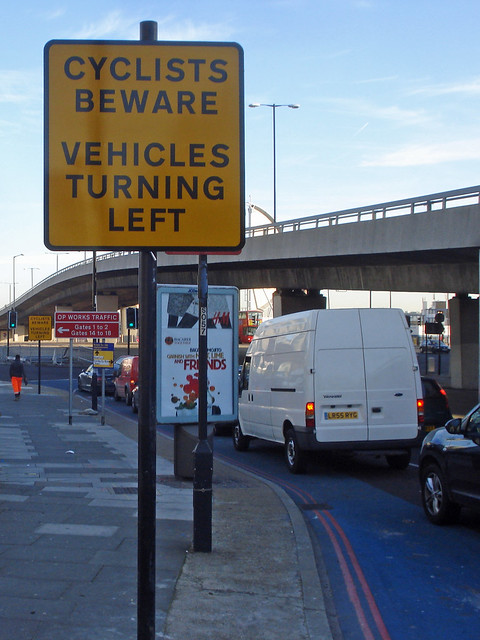
Looking at some recent Department for Transport statistics, it looks as though I can do another 125,000 miles or so before I can expect another entry in the national traffic casualty lists, as long as I stay alert and keep an eye on tricky junctions in the rain after dark. The one thing that worries me about the apparent increase in the popularity of cycling is that not much is happening about all those junctions where traffic speed is such a threat. Another recent report puts traffic speed and difficult junctions as the main problems. The TRL summary report to the DFT, "Infrastructure and Cyclist Safety" says:
"Most cyclist injuries in multi-vehicle collisions take place at junctions. Reducing the speed of traffic through junctions appears to be an effective approach to reducing cycle casualties, and physical calming methods are a reliable means of achieving such a reduction."
Infrastructure and Cyclist Safety (2011) TRL Report PPR 580
The same report is a bit chary of the piecemeal cycle lanes and other non-continuous facilites that British cities chose to provide: not because they aren't a great help, but because they keep (as it were) dropping the baby:
"Providing segregated networks may reduce risks to cyclists, although evidence suggests that the points at which segregated networks intersect with highways can be relatively high-risk, sometimes of sufficient magnitude to offset any safety benefits of removing cyclists from the carriageway."